

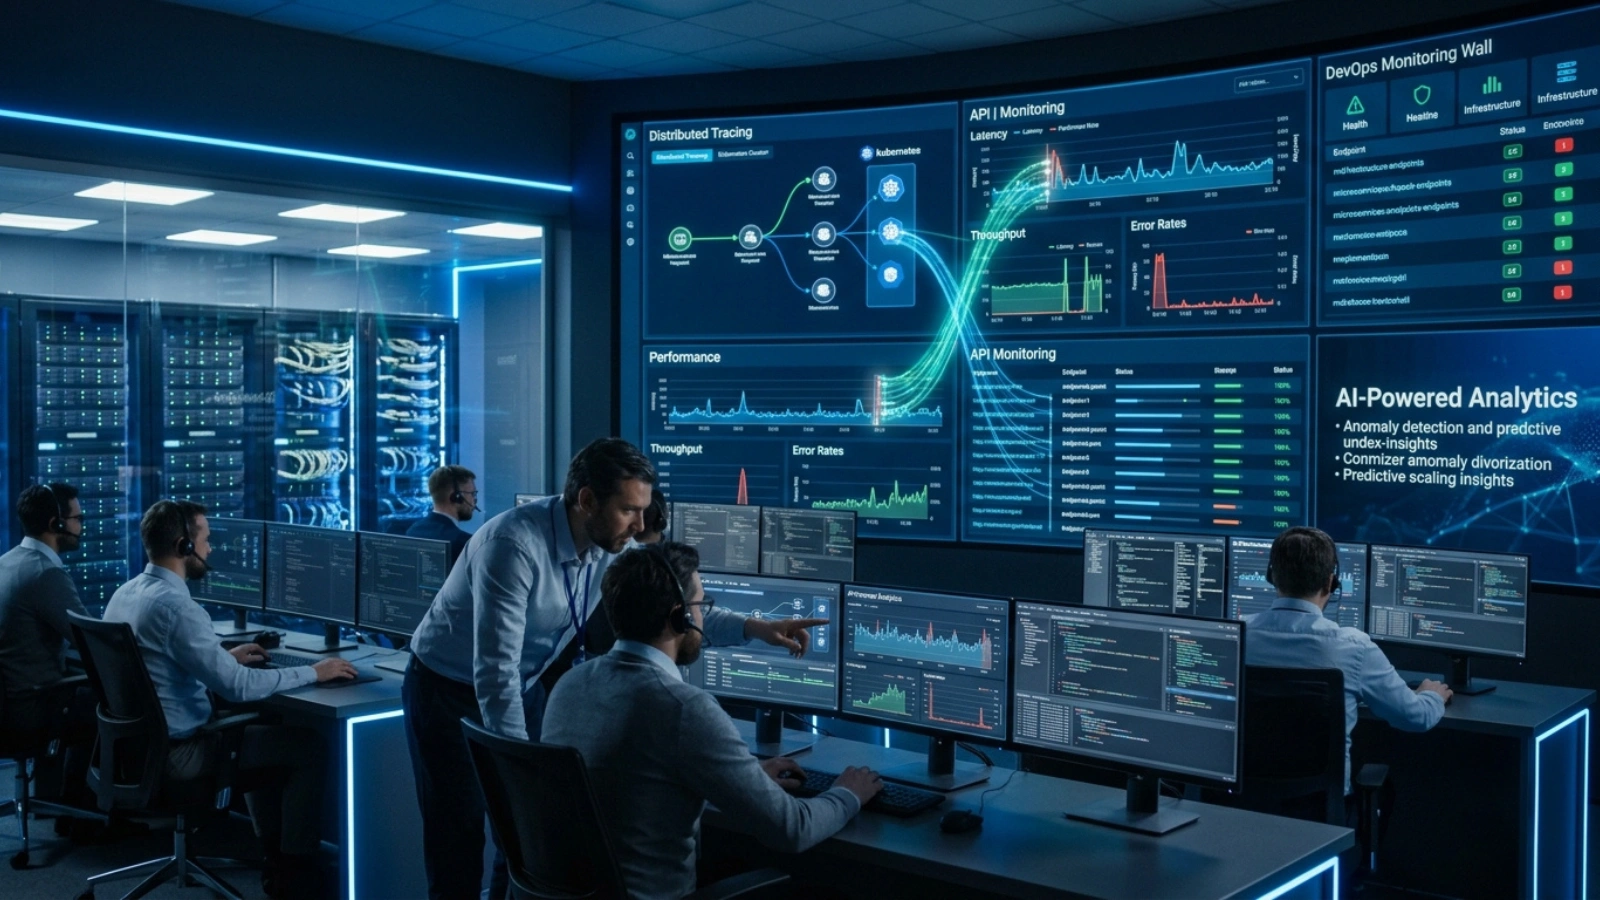
The software industry is entering a new era where application performance is no longer judged only by speed. Modern users expect digital products to be fast, stable, scalable, resilient, and always available. Even a few seconds of downtime or latency can lead to lost revenue, damaged reputation, reduced customer trust, and declining user engagement.
As businesses continue migrating toward cloud-native architectures, microservices, Kubernetes, APIs, edge computing, and AI-powered platforms, software ecosystems have become far more complex than ever before. Traditional performance testing approaches that once worked for monolithic applications are now struggling to provide meaningful insights in highly distributed environments.
This is why Observability-Driven Performance Testing is rapidly becoming mainstream in 2026.
Organizations are no longer satisfied with simply running load tests and checking server utilization graphs. Instead, they want complete visibility into how systems behave internally during performance tests. They want to know:
- Which microservice caused latency?
- Which database query became slow?
- Which API dependency failed?
- Which Kubernetes pod restarted unexpectedly?
- Which infrastructure component became overloaded?
- How did the issue impact actual users?
Observability-driven performance testing answers these questions by combining:
- Load testing
- Monitoring
- Logging
- Distributed tracing
- AI-powered analytics
- Real-time telemetry
This new testing approach is transforming Quality Assurance, Performance Engineering, DevOps, and Site Reliability Engineering across the global software industry.
The Evolution of Performance Testing
Performance testing has evolved significantly over the last two decades.
Traditional Performance Testing Era
Earlier performance testing primarily focused on:
- Response time measurement
- Throughput analysis
- Concurrent user simulation
- CPU and memory monitoring
- Basic stress testing
Teams used tools like:
- Apache JMeter
- LoadRunner
- NeoLoad
- Silk Performer
Applications were usually monolithic and hosted on dedicated servers, making performance analysis relatively straightforward.
If an application slowed down, engineers could often identify the issue quickly because the architecture was centralized.
The Rise of Distributed Architectures
Modern software systems are vastly different.
Today’s applications rely on:
- Microservices
- Containers
- Kubernetes clusters
- APIs
- Serverless computing
- Multi-cloud environments
- CDN networks
- Event-driven systems
A single user transaction may travel through dozens of interconnected services before completion.
For example, an e-commerce checkout flow may involve:
- Authentication services
- Inventory systems
- Payment gateways
- Fraud detection APIs
- Recommendation engines
- Shipping services
- Notification systems
If performance degrades, identifying the root cause becomes extremely challenging.
This complexity gave rise to observability.
What Is Observability?
Observability is the ability to understand a system’s internal state by analyzing the data it generates.
Observability provides deep insights into:
- Application behavior
- Infrastructure performance
- Network communication
- Service dependencies
- Failure patterns
- User interactions
The three pillars of observability are:
1. Metrics
Metrics provide numerical performance measurements.
Examples:
- CPU usage
- Memory utilization
- API latency
- Request rates
- Error percentages
- Database query duration
Metrics help teams detect performance abnormalities quickly.
2. Logs
Logs record detailed system events.
Examples:
- Application errors
- Authentication failures
- Database connection issues
- Timeout exceptions
- Deployment activities
Logs provide context behind failures.
3. Distributed Traces
Tracing tracks requests across multiple services.
Distributed tracing shows:
- Transaction flow
- Service dependencies
- Latency distribution
- Failure locations
Tracing is especially critical in microservices-based systems.
Why Observability Matters in Performance Testing
Traditional load testing alone cannot fully explain why systems fail under load.
For example:
- A load test may show high response times.
- But without observability, engineers may not know:
- Which service slowed down
- Why the slowdown occurred
- Whether infrastructure scaling failed
- If third-party APIs caused the issue
Observability fills these visibility gaps.
By integrating observability into performance testing, teams can:
- Diagnose issues faster
- Improve system reliability
- Reduce debugging time
- Prevent production outages
- Optimize infrastructure usage
Observability-Driven Performance Testing Explained
Observability-driven performance testing combines:
- Performance testing tools
- Telemetry collection
- Real-time monitoring
- Distributed tracing
- AI-based analytics
During load tests, observability systems continuously collect:
- Infrastructure metrics
- Application logs
- Network data
- Transaction traces
- User behavior analytics
This creates a complete operational picture of the application under stress.
Real-World Example
Imagine a streaming platform preparing for a major sports event.
Millions of users are expected to access the platform simultaneously.
The QA team performs performance testing using k6 or JMeter.
Traditional testing may reveal:
- Increased response times
- Higher CPU utilization
- Error spikes
However, observability reveals deeper insights:
- A recommendation service became overloaded
- Database read latency increased by 400%
- Kubernetes autoscaling triggered too late
- One API gateway region experienced packet loss
- A third-party analytics service caused thread blocking
This level of visibility dramatically improves troubleshooting accuracy.
Key Technologies Driving This Trend
Kubernetes
Kubernetes environments are highly dynamic.
Pods may:
- Scale automatically
- Restart frequently
- Shift across nodes
Traditional monitoring tools struggle in these environments.
Observability platforms provide:
- Container-level visibility
- Cluster health analysis
- Pod lifecycle monitoring
- Resource allocation insights
Microservices Architecture
Microservices improve scalability but increase complexity.
A single application may contain:
- Hundreds of services
- Thousands of API calls
- Distributed databases
- Event-driven communication
Distributed tracing becomes essential for identifying bottlenecks.
Cloud Computing
Cloud-native systems generate enormous telemetry data.
Observability helps organizations monitor:
- Cloud costs
- Resource consumption
- Regional performance
- Traffic spikes
- Infrastructure health
APIs and Third-Party Services
Modern applications heavily depend on APIs.
Performance issues may originate from:
- Slow payment gateways
- External authentication providers
- Mapping services
- AI APIs
- CDN providers
Observability tools track dependency performance in real time.
AI-Powered Observability Is Changing Everything
Artificial Intelligence is becoming one of the most transformative aspects of modern observability.
AI-driven observability platforms can:
- Detect anomalies automatically
- Predict infrastructure failures
- Identify unusual traffic patterns
- Correlate logs and traces
- Suggest root causes
- Generate performance insights
Instead of manually analyzing thousands of metrics and logs, AI systems can instantly highlight the most critical issues.
AIOps and Performance Engineering
AIOps (Artificial Intelligence for IT Operations) is now merging with performance testing.
AIOps platforms help teams:
- Reduce alert fatigue
- Detect incidents proactively
- Predict capacity requirements
- Automate issue resolution
- Improve operational efficiency
This significantly enhances modern performance engineering workflows.
Shift-Left Performance Engineering
The software industry is aggressively adopting Shift-Left practices.
This means testing starts earlier in development.
Performance testing is now integrated into:
- CI/CD pipelines
- Pull request validation
- Automated deployments
- Developer workflows
Observability enables developers to detect:
- Performance regressions
- Memory leaks
- Slow queries
- API bottlenecks
before production deployment.
Continuous Performance Testing
Performance testing is no longer a one-time pre-release activity.
Modern organizations perform:
- Continuous load testing
- Synthetic monitoring
- Real-user monitoring
- Chaos engineering
- Reliability testing
Performance validation now happens continuously throughout the software lifecycle.
The Growing Role of OpenTelemetry
OpenTelemetry has become the standard for telemetry collection.
It enables:
- Unified observability pipelines
- Vendor-neutral instrumentation
- Easier monitoring integration
- Standardized telemetry collection
OpenTelemetry supports:
- Metrics
- Logs
- Traces
Many enterprises are standardizing their observability architecture around OpenTelemetry.
Popular Tools in Observability-Driven Testing
Performance Testing Tools
- k6
- Apache JMeter
- Gatling
- Locust
- BlazeMeter
- LoadRunner
Observability Platforms
- Grafana
- Datadog
- Dynatrace
- New Relic
- Elastic Stack
- Splunk
Monitoring & Metrics Tools
- Prometheus
- Grafana Loki
- InfluxDB
- AWS CloudWatch
- Azure Monitor
Distributed Tracing Tools
- Jaeger
- Zipkin
- OpenTelemetry
Benefits of Observability-Driven Performance Testing
Faster Root Cause Analysis
Teams can quickly identify the exact source of issues.
This dramatically reduces troubleshooting time.
Better Collaboration
QA, DevOps, developers, and SRE teams work using shared observability data.
This improves cross-functional collaboration.
Improved User Experience
Organizations can proactively fix latency issues before customers are impacted.
Higher System Reliability
Continuous visibility helps prevent major production outages.
Smarter Infrastructure Optimization
Observability helps optimize:
- Cloud costs
- Resource allocation
- Auto-scaling policies
- Capacity planning
Reduced Downtime
Real-time monitoring helps teams respond to incidents faster.
Challenges Organizations Face
Massive Data Volumes
Telemetry systems generate huge amounts of data.
Managing and analyzing this data can be expensive and complex.
Tool Integration Complexity
Organizations often use multiple observability tools.
Integrating these platforms requires expertise.
Skill Shortages
Modern performance engineering now requires knowledge of:
- Cloud platforms
- DevOps
- Kubernetes
- Distributed systems
- Observability
- SRE practices
Finding skilled professionals is becoming increasingly difficult.
Cost Concerns
Observability platforms can become expensive at enterprise scale due to:
- Data ingestion
- Storage costs
- Retention policies
- High telemetry volumes
Industry Trends in 2026
AI-Native Testing Platforms
AI-native QA platforms are emerging rapidly.
These platforms combine:
- Test automation
- Performance testing
- Monitoring
- AI analytics
- Observability
into unified ecosystems.
Autonomous Performance Testing
Future systems may automatically:
- Generate test scenarios
- Predict failures
- Optimize workloads
- Heal infrastructure issues
with minimal human intervention.
Unified QA + Observability Platforms
The boundaries between:
- QA
- Monitoring
- DevOps
- SRE
are gradually disappearing.
Organizations now want unified engineering platforms.
The Future of Performance Engineering
Performance engineering is evolving from reactive testing to proactive intelligence.
Future systems will focus on:
- Predictive analytics
- Self-healing infrastructure
- AI-driven incident response
- Intelligent scalability optimization
- Real-time customer experience monitoring
Observability will become the foundation of digital reliability engineering.
Conclusion
Observability-driven performance testing is no longer an experimental concept it is rapidly becoming the industry standard.
As software ecosystems become more distributed, cloud-native, and API-driven, organizations require deeper operational visibility than traditional testing approaches can provide.
By combining:
- Load testing
- Real-time telemetry
- Distributed tracing
- AI-powered analytics
- Continuous monitoring
businesses can build applications that are:
- Faster
- More reliable
- Highly scalable
- Operationally resilient
The future of software quality lies in intelligent observability-driven engineering.
In 2026 and beyond, organizations that embrace observability-driven performance testing will gain significant advantages in:
- Application reliability
- User experience
- Operational efficiency
- Digital transformation success
- Competitive innovation
Observability is no longer just a monitoring strategy it is becoming the backbone of modern performance testing and software quality engineering.
For more Contact US